Outputs
in a notebook
when you run
from cellpose import io, models
img = io.imread("img.tif")
masks, flows, styles = models.CellposeModel(gpu=True).eval(img)
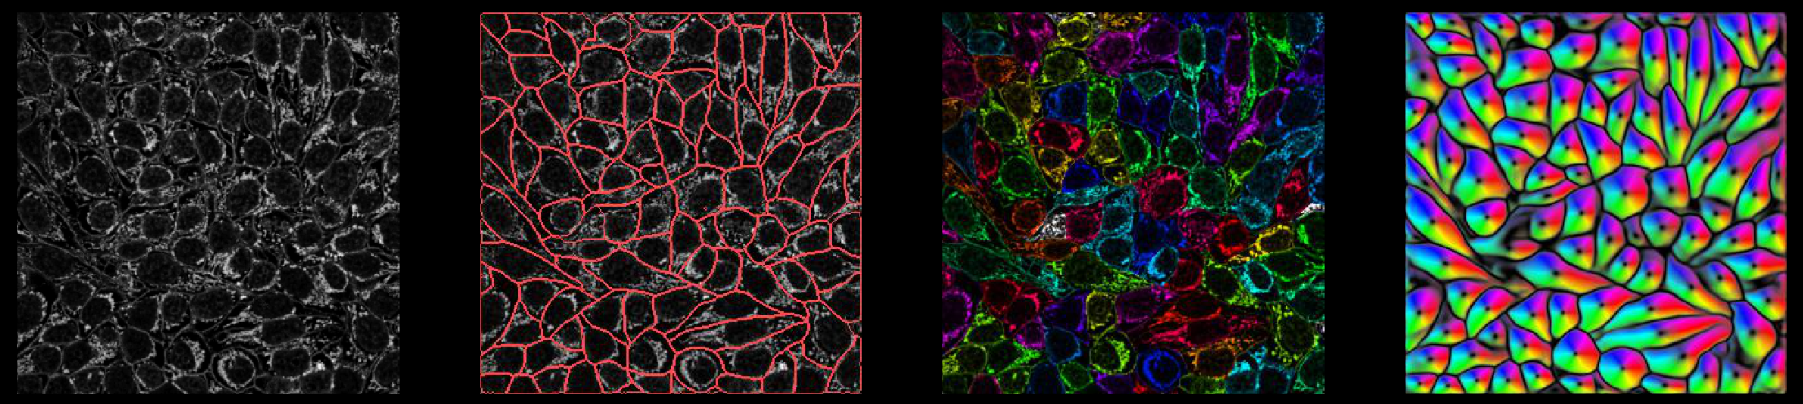
Internally, the network predicts 3 (or 4) outputs:
(flows in Z), flows in Y, flows in X, and cellprob.
The predictions the network makes of cellprob are used as inputs to a sigmoid
centered at zero (1 / (1 + e^-x)) in the loss function (binary cross-entropy loss),
so they vary from around -10 to +10. These are
output from the eval function as the second variable flows. The Y flows and X flows are used
to simulate a dynamical system on the pixels, which is run on only pixels with a
cellprob > cellprob_threshold. All pixels which converge to the same point are assigned the same
label in the masks output, of size (Lz x) Ly x Lx (0 = NO ROI; 1,2,… = ROI labels).
The styles are the sum over pixels of the output of the last downsampling layer of the network.
Cellpose also produces various outputs from the command line and the GUI, which are described below:
_seg.npy output
*_seg.npy files have the following fields:
filename : filename of image
masks : each pixel in the image is assigned to an ROI (0 = NO ROI; 1,2,… = ROI labels)
outlines : outlines of ROIs (0 = NO outline; 1,2,… = outline labels)
chan_choose : channels that you chose in GUI (0=gray/none, 1=red, 2=green, 3=blue)
ismanual : element k = whether or not mask k was manually drawn or computed by the cellpose algorithm
- flows :
flows[0] is XY flow in RGB
flows[1] is the cell probability in range 0-255 instead of -10.0 to 10.0
flows[2] is Z flow in range 0-255 (if it exists, otherwise zeros),
flows[3] is [dY, dX, cellprob] (or [dZ, dY, dX, cellprob] for 3D), flows[4] is pixel destinations (for internal use)
zdraw : for each mask, which planes were manually labelled (planes in between manually drawn have interpolated ROIs)
Note: the ‘img’ is no longer saved in the *_seg.npy file to save time.
Here is an example of loading in a *_seg.npy file and plotting masks and outlines
import numpy as np
from cellpose import plot, utils, io
dat = np.load('_seg.npy', allow_pickle=True).item()
img = io.imread('img.tif')

# plot image with masks overlaid
mask_RGB = plot.mask_overlay(img, dat['masks'],
                        colors=np.array(dat['colors']))

# plot image with outlines overlaid in red
outlines = utils.outlines_list(dat['masks'])
plt.imshow(img)
for o in outlines:
    plt.plot(o[:,0], o[:,1], color='r')
If you run in a notebook and want to save to a *_seg.npy file, run
from cellpose import io
io.masks_flows_to_seg(images, masks, flows, file_name, channels=channels, diams=diams)
where each of these inputs is a list (as the output of model.eval is)
PNG output
You can save masks to PNG in the GUI.
To save masks (and other plots in PNG) using the command line, add the flag --save_png.
Or use the function below if running in a notebook
from cellpose import io
io.save_masks(images, masks, flows, image_names, png=True)
Native ImageJ ROI archive output
You can save the outlines of the ROIs in a ImageJ-native ROI archive file. Rather than using the legacy solution below, you can use this function to create an ROI archive file that can be opened in directly in ImageJ. Recent versions of ImageJ can autodetect the file format. Open in ImageJ using File > Open… and select the file. The ROIs will appear in the ROI manager.
To save the outlines using the CLI use the flag --save_rois.
To save the outlines using the API use the save_rois function in io.py:
This function is also available in the GUI.
from cellpose import io, utils

# image_name is file name of image
# masks is numpy array of masks for image
io.save_rois(masks, '<your_filename_string>')

# the file will be saved as '<your_filename_string>_rois.zip'
(Legacy ImageJ Interface) ROI manager compatible output for ImageJ
You can save the outlines of ROIs in a text file that’s compatible with ImageJ ROI Manager in the GUI File menu.
To save using the command line, add the flag --save_outlines.
Or use the function below if running in a notebook
from cellpose import io, utils

# image_name is file name of image
# masks is numpy array of masks for image
base = os.path.splitext(image_name)[0]
outlines = utils.outlines_list(masks)
io.outlines_to_text(base, outlines)
To load this _cp_outlines.txt file into ImageJ, use the python script
provided in cellpose: imagej_roi_converter.py. Run this as a macro after
opening your image file. It will ask you to input the path to the _cp_outlines.txt
file. Input that and the ROIs will appear in the ROI manager.
Plotting functions
In plot.py there are functions, like show_segmentation:
from cellpose import plot

nimg = len(imgs)
for idx in range(nimg):
    maski = masks[idx]
    flowi = flows[idx][0]

    fig = plt.figure(figsize=(12,5))
    plot.show_segmentation(fig, imgs[idx], maski, flowi, channels=channels[idx])
    plt.tight_layout()
    plt.show()