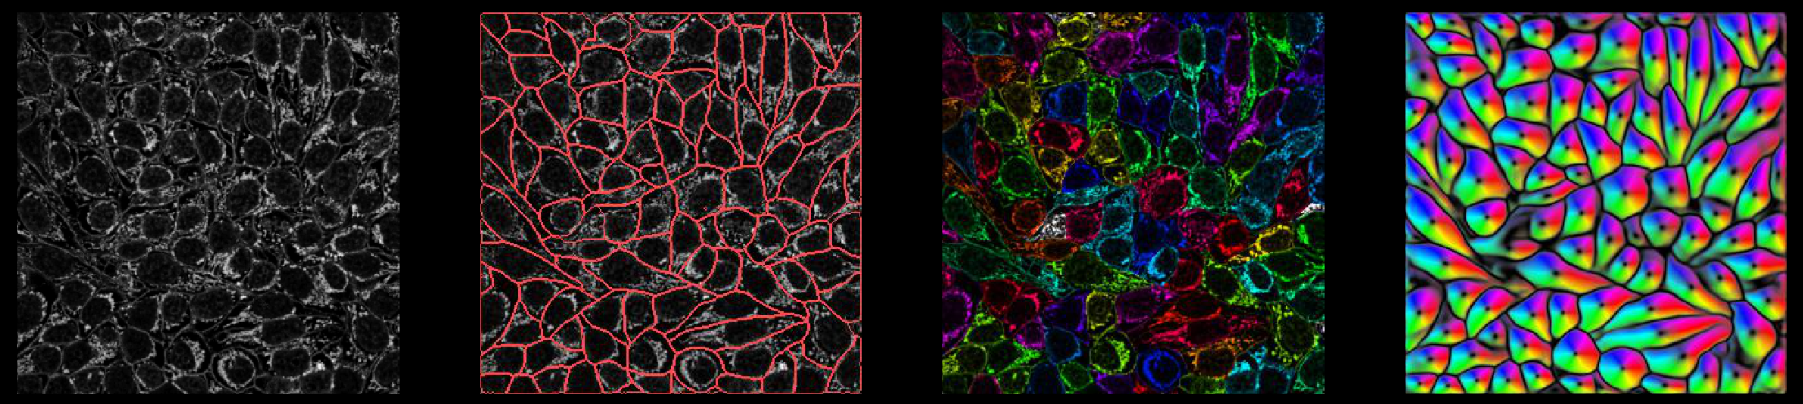
Outputs
Internally, the network predicts 3 (or 4) outputs: (flows in Z), flows in Y, flows in X, and cellprob. The predictions the network makes of cellprob are the inputs to a sigmoid centered at zero (1 / (1 + e^-x)), so they vary from around -6 to +6.
_seg.npy output
*_seg.npy files have the following fields:
filename : filename of image
img : image with chosen channels (nchan x Ly x Lx) (if not multiplane)
masks : masks (0 = NO masks; 1,2,… = mask labels)
colors : colors for masks
outlines : outlines of masks (0 = NO outline; 1,2,… = outline labels)
chan_choose : channels that you chose in GUI (0=gray/none, 1=red, 2=green, 3=blue)
ismanual : element k = whether or not mask k was manually drawn or computed by the cellpose algorithm
- flowsflows[0] is XY flow in RGB, flows[1] is the cell probability in range 0-255 instead of 0.0 to 1.0, flows[2] is Z flow in range 0-255 (if it exists, otherwise zeros),
flows[3] is [dY, dX, cellprob] (or [dZ, dY, dX, cellprob] for 3D), flows[4] is pixel destinations (for internal use)
est_diam : estimated diameter (if run on command line)
zdraw : for each mask, which planes were manually labelled (planes in between manually drawn have interpolated masks)
Here is an example of loading in a *_seg.npy file and plotting masks and outlines
import numpy as np
from cellpose import plot
dat = np.load('_seg.npy', allow_pickle=True).item()

# plot image with masks overlaid
mask_RGB = plot.mask_overlay(dat['img'], dat['masks'],
                        colors=np.array(dat['colors']))

# plot image with outlines overlaid in red
outlines = plot.outlines_list(dat['masks'])
plt.imshow(dat['img'])
for o in outlines:
    plt.plot(o[:,0], o[:,1], color='r')
If you run in a notebook and want to save to a *_seg.npy file, run
from cellpose import io
io.masks_flows_to_seg(images, masks, flows, diams, file_name, channels)
where each of these inputs is a list (as the output of model.eval is)
PNG output
You can save masks to PNG in the GUI.
To save masks (and other plots in PNG) using the command line, add the flag --save_png.
Or use the function below if running in a notebook
from cellpose import io
io.save_to_png(images, masks, flows, image_names)
ROI manager compatible output for ImageJ
You can save the outlines of masks in a text file that’s compatible with ImageJ ROI Manager in the GUI File menu.
To save using the command line, add the flag --save_png.
Or use the function below if running in a notebook
from cellpose import io, plot

# image_name is file name of image
# masks is numpy array of masks for image
base = os.path.splitext(image_name)[0]
outlines = utils.outlines_list(masks)
io.outlines_to_text(base, outlines)
To load this _cp_outlines.txt file into ImageJ, use the python script
provided in cellpose: imagej_roi_converter.py. Run this as a macro after
opening your image file. It will ask you to input the path to the _cp_outlines.txt
file. Input that and the ROIs will appear in the ROI manager.
Plotting functions
In plot.py there are functions, like show_segmentation:
from cellpose import plot

nimg = len(imgs)
for idx in range(nimg):
    maski = masks[idx]
    flowi = flows[idx][0]

    fig = plt.figure(figsize=(12,5))
    plot.show_segmentation(fig, imgs[idx], maski, flowi, channels=channels[idx])
    plt.tight_layout()
    plt.show()